AI Analytics Assistant
CLEVER
Guided a strategic pivot to focusing on user-level data, resulting in $92K ARR for an enhanced analytics service package, by testing Clever’s first AI proof of concept

Jan - May 2025
TIMELINE
1 product manager
1 engineering manager
1 designer
5 engineers
TEAM
Product researcher and designer
ROLE
Query chain analysis
Bullseye customer
FOCUS
At-a-glance summary
Question
The executive team wanted to know: how well does Clever’s AI-powered analytics proof of concept address customer needs?
Approach
I chose to conduct mixed methods research in phases to build confidence amongst the executive team. With this approach, they could see that our team was learning how well the proof of concept addressed customer needs from multiple angles and in stages of learning:
Bullseye customer sprint to identify which district administrators were most likely to be early adopters for testing.
Query chain analysis to observe how district admins interacted with AI analytics and how well it responded to their prompts.
1:1 interviews to hear from district admins how they interacted with AI analytics and how well it met their needs.
Pre and post surveys to compare what admins reported they wanted to achieve with AI Analytics with what they experienced.
Impact
Met business objective by presenting the testing results to the executive team and identifying that AI Analytics is not yet meeting customer needs.
Highlighted the main risks testing revealed, which guided a strategic pivot to focusing on user-level data and enhanced an analytics service package that preexisted the AI Analytics Assistant, resulting in $92K ARR.
Context
Identifying AI opportunities for Clever
CONTEXT
In 2024 Clever witnessed an adoption of generative AI tools across K12 schools and our edtech application partners.
As a result, our executive team wanted to develop hypotheses for how these changes affect our product strategy and whether they open up new opportunities for us.
From Jul - Sep 2024, I partnered with our director of product to investigate whether there was a Clever-shaped problem that revealed a product and revenue opportunity.
That investigation revealed three such opportunities that we presented to the executive team.

The three AI opportunities we identified and presented to the executive team
Focusing on AI-powered analytics
CONTEXT
Of the three opportunities we identified, AI-powered analytics resonated most with our customers.
For our district administrator customers specifically, having an easy way to query and interpret analytics data on edtech app usage was a longstanding unmet need.
After presenting these findings to our executive team, they asked our team to investigate the AI-powered analytics opportunity further.
My task as a researcher was to inform the development of an AI-powered analytics proof of concept and test its performance to assess how well it addressed customer needs.
Identifying early adopters for testing
Research goals
PLANNING
Although our team knew there was an opportunity for Clever to provide value to district administrators, we weren’t sure what type of district administrator would find AI-powered analytics most valuable.
The purpose of setting goals and criteria was to make sure we had the information we needed to identify which type of DA would be most likely to find value in AI-powered analytics so we could target our outreach for testing a proof of concept.
Research goal
Validate and refine a hypothesis about who will be Clever’s bullseye customers for AI Analytics.
Identify the features and unique value propositions those customers will value most.
Connect the team directly with the customer and motivate them to dive into the project work following the sprint.
Success criteria
We feel confident enough in our bullseye customer definition to begin outreach for testing a proof of concept.
We have enough data to prioritize what features will be included in our proof of concept.
We can see the team is motivated to dive into developing the proof of concept.
Bullseye customer sprint
METHODOLOGY
Since we wanted to identify what type of district administrator would be most likely to find value in our AI-analytics proof of concept, and therefore be most likely to test it as an early adopter, I chose a method focused on identifying early adopters for new products: the bullseye customer sprint.
The bullseye customer is made up of showing five bullseye customers three simple prototypes during a one-hour interview over one (or two) days.
Further the learning takes place collaboratively as an entire team during a watch party where everyone has a role to participate in the research.
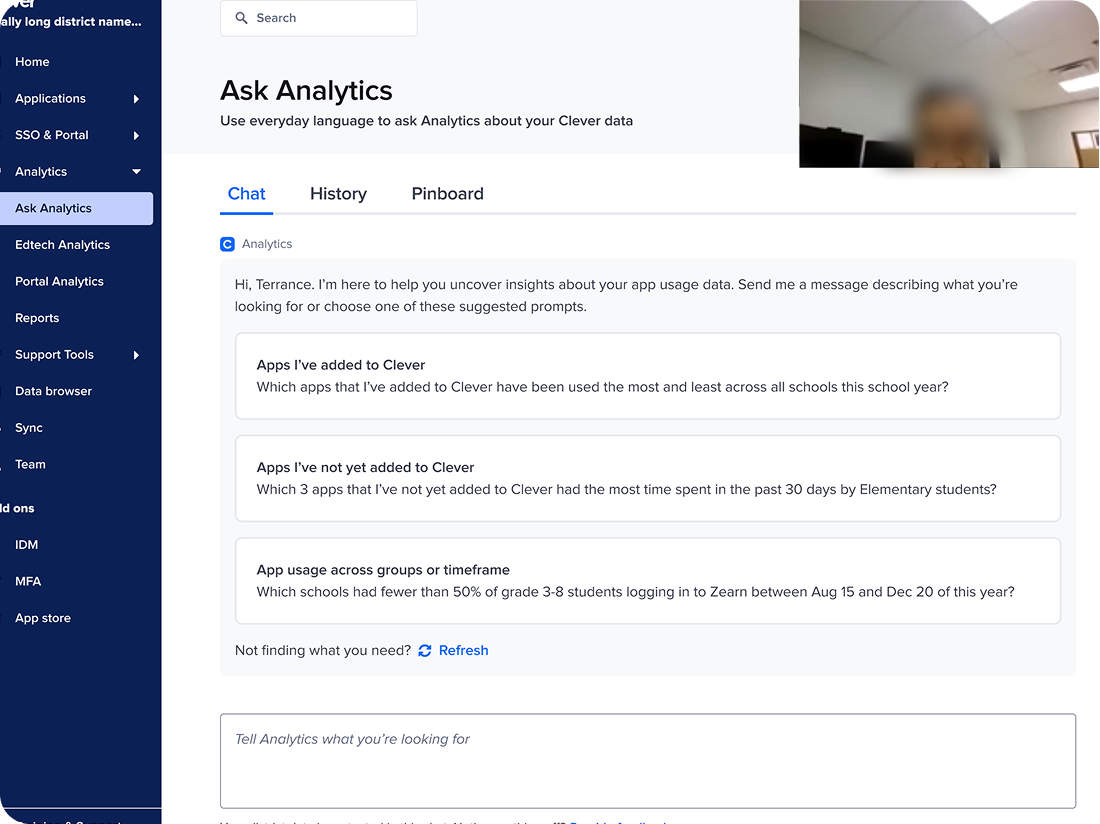
The three prototypes I showed participants during the bullseye customer sprint watch party.
I adapted the bullseye customer sprint from Michael Margolis’ 2024 book, Learn More Faster.
Defining the bullseye customer
RECRUITMENT
Following the bullseye customer framework, I collaborated with my product manager and engineer manager to develop inclusion criteria, exclusion criteria, and trigger events, which helped us create the first draft of our bullseye customer definition.
Inclusion criteria
Personally, uses Clever to monitor app usage at their school district and uses/pulls the data themselves.
Has pain with answering app usage questions today.
Asked to inform decision-making based on knowledge of app usage (e.g. triage app rollout issues, budgeting decisions for apps).
Works at a mid sized district (16-60 schools).
Has used an AI chatbot before and has used excel or sheets in the past month.
Exclusion criteria
Does not use Clever personally, even if someone on their team or at their district does
Has had issues with improperly handling sensitive data in the past.
Has done work as a professional data analyst before.
Trigger events
Rolled out a new application to schools in district and wants to check to see if and how it is being used.
Budget season (remove apps): evaluating to see if and how paid, on-clever applications are being used.
Budget season (add apps): evaluating to see if and how unpaid, off-clever applications are being used.
Creating a screener for outreach
RECRUITMENT
Using our initial bullseye customer definition, I created a screener to help us recruit participants for our watch party.
All the questions in the screener were directly related to the inclusion and exclusion criteria we had created to help us decide which participants should be included in the watch party.
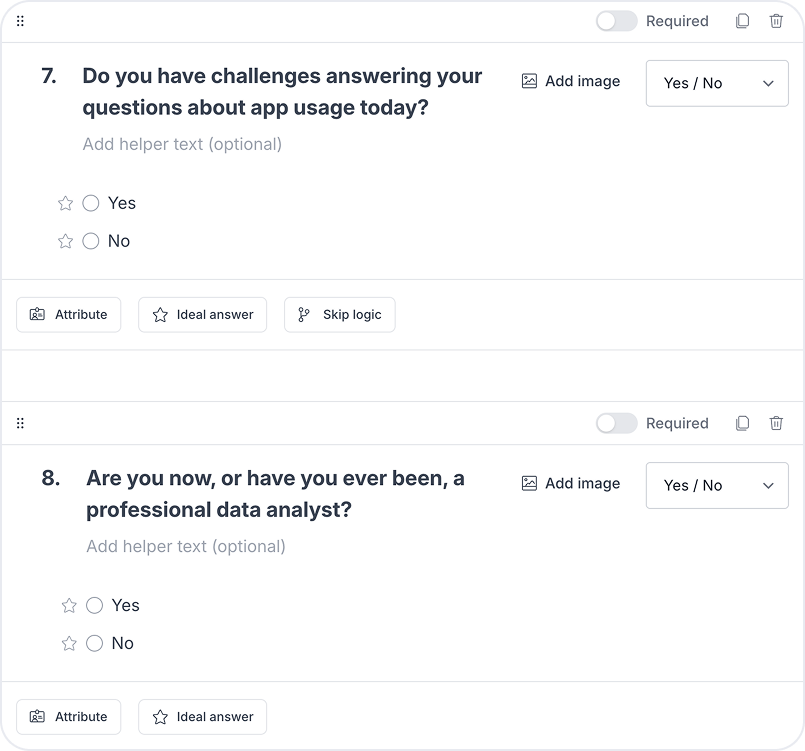
The questions in the screener reflected our inclusion and exclusion criteria to help us decide who to include in the watch party.
Contacting recent analytics users
RECRUITMENT
To develop a pool of participants to send the screener to, we pulled data on which district administrators had used our analytics products in the last 60 days.
Knowing we wanted 5 participants, we broke down that list of thousands of users into batches or 150 so that we could do limited outreach until we met our participant goal.
Further, we vetted the district administrators on our first batch of 150 with their respective customer success managers (CSMs) to ensure they were ok with us contacting their customers about research related to AI.
As a result, we emailed our screener to 110 district admins vetted by their CSMs, 10 completed the screener, and we selected 5 participants.
I assigned everyone on the team a role to play throughout the watch party calls so that we were all engaged in the research.
That engagement in the research came in handy when we did our first pass at synthesis after each call and when we did final our synthesis with a big takeaways reflection form at the end.
Everyone played a role during the watch party to help synthesize
SYNTHESIS

After each call during the watch party, the engineer I had assigned the “debriefer” role would guide the team through questions I prepared to do our first pass at synthesis.
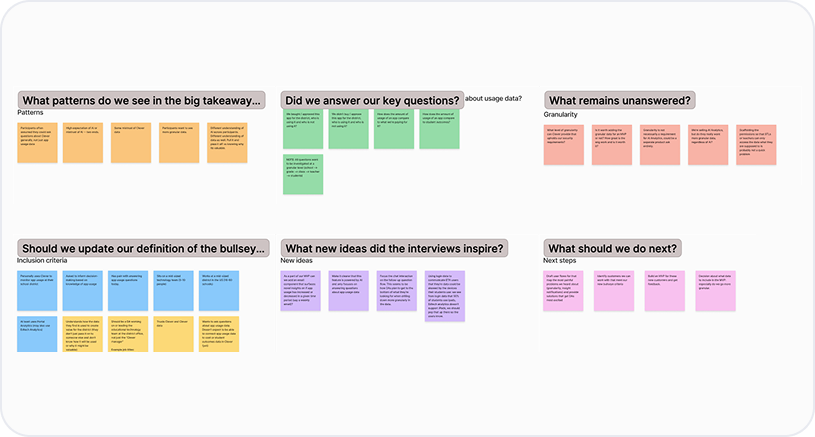
At the end of the second day, after we had completed all five calls, the team completed a big takeaways form that I prepared for them. We then affinity mapped these big takeaways into themes as a final debrief.
During the watch party we found some of the participants had issues trusting Clever analytics data based on their past experience while others did not.
Participants who had issues with trust said this was due to seeing discrepancies in the analytics Clever reported on an app’s usage versus the analytics that individual app reported on its platform.
This enabled us to refine our bullseye customer definition to include a new inclusion criteria: the district admin already trusts Clever and Clever data.
District admins must already trust Clever data to be considered a bullseye customer
BULLSEYE CUSTOMER INSIGHT
A participant explains that they’ve had issues trusting Clever data in the past. This led us to exclude this type of participant from our bullseye customer definition because they would need to trust Clever data to be an early adopter of AI Analytics.
District admins want to ask AI who is using apps they bought for the district and who is using apps they didn’t buy
BULLSEYE CUSTOMER INSIGHT
All 5 participants reported wanting answers to these questions to identify which schools needed support with apps they’d bought and get a better understanding of the value schools were getting out of the apps they didn’t buy.

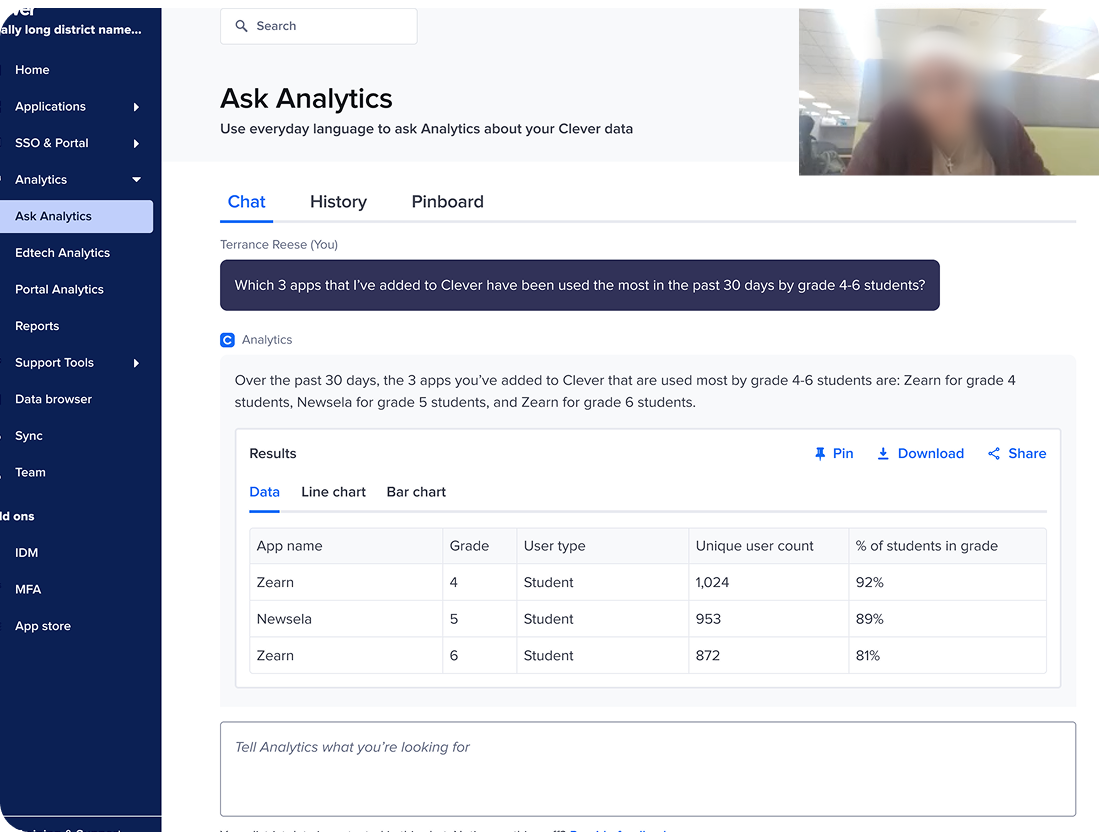
While looking at this prototype, admins said that knowing the least usage for apps already added to Clever and the most usage for apps not yet added to Clever would be most valuable to them.
District admins were most excited to ask AI questions that drill down deeper than what they can see in current Clever analytics
BULLSEYE CUSTOMER INSIGHT
Admins reported that one of their biggest pain points with analytics today is not being able to drill down into data at different levels of granularity: school > grade > class > individual teacher or student user.

Looking at this prototype, admins said they would want to ask follow-up questions to drill down further such as: which schools have the greatest 4th grade usage of Zearn?
Studio share out with the product and design team
SHARING AND ACTIVATION
In the studio share out, I shared our revised definition of the bullseye customer, the workflow we learned was highest priority for this bullseye customer, and the proof of concept testing we planned to conduct next.

The highest priority workflow for the bullseye customer was “keep a pulse on app usage” because it happened a few times a month. Another workflow, “take a step back and evaluate app strategy”, only happened a few times a year so we deprioritized it.
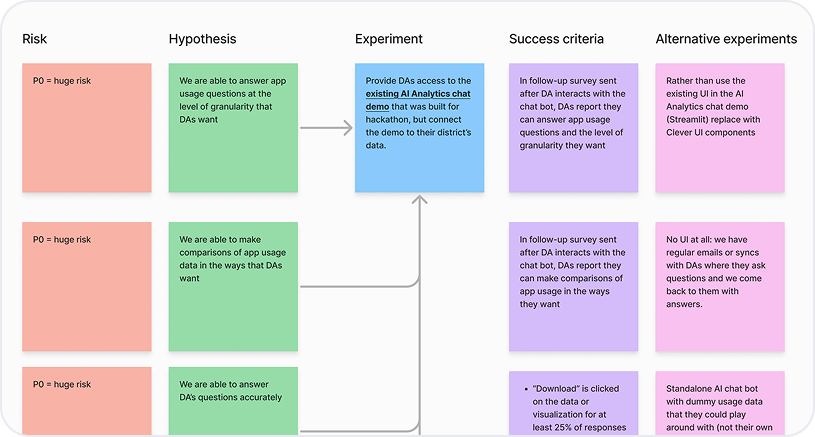
For our proof of concept testing experiment, I outlined the risks, hypotheses, success criteria, and alternative experiments.
Preparing for proof of concept testing
PLANNING
Now that we had a working definition of our bullseye customer and a sense of which workflow we wanted to prioritize, we were ready to test our AI Analytics proof of concept.
The purpose of setting goals and criteria was to ensure we had the information we needed to evaluate the risks associated with how close our proof of concept was to meeting the needs of our bullseye customers.
Research goals
Research goal
Determine whether admins can confidently answer relevant and useful questions about analytics in an amount of time and at a level of comprehension that is usable for them.
Describe how well the proof of concept meets admins’ needs.
Success criteria
In qualitative review of prompt/response logs, at least 50% of AI responses to admin queries have a “good” quality rating
During interviews, at least 50% of admins report they are getting to their eventual, actionable answers most of the time.
During interviews, at least 50% of admins who use AI analytics report that if we took it away they would be upset.
During interviews, at least 25% of admins who use AI analytics report that they would pay to keep using it.
I chose to triangulate across three different methodologies over the course of the one month testing period to pair behavioral observation with attitudinal self-reporting.
We chose a one month testing period to get a sense of how often an admin would use this tool and what kinds of questions they would ask if they had access over an extended period of time.
Triangulating across three methodologies over one month
METHODOLOGY
Query chain analysis
Observe how district admins interacted with AI analytics and how well it responded to their prompts.
1:1 interviews
Hear from admins how they interacted with AI analytics and how well it met their needs.
Pre and post surveys
Compare what admins reported they wanted to achieve with AI Analytics with what they experienced.
Expanding the pool of bullseye customers
RECRUITMENT
We wanted to test our proof of concept with at least 5 bullseye customer participants because this is a generally accepted industry minimum that uncovers ~85% of issues, and would therefore help our team feel confident in determining whether we were meeting customer needs.
During the bullseye customer sprint, we found that 3 of 5 participants met our revised bullseye customer definition, we reached out to them for testing, and they accepted.
I then reached out to 5 more participant districts that had completed the bullseye customer screener, met the criteria, but had not responded to outreach for the bullseye customer sprint. 3 of them responded and accepted our offer for testing.
As a result, we had 6 test districts, some with more than one admin testing if those additional admins were on the same team as the bullseye customer.
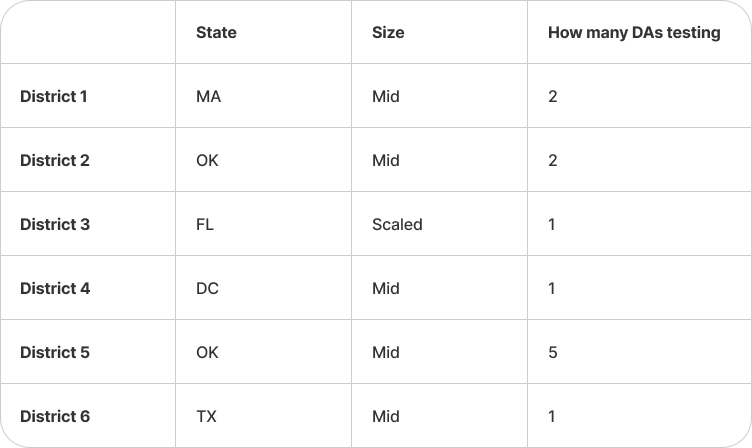
Observing how district admins and AI interact
Query chain analysis
METHODOLOGY
I chose to conduct a query chain analysis to get a clearer sense of what kinds of questions admins were asking and how well AI Analytics could answer them.
I collaborated with my engineering team to track which queries participants asked AI Analytics.
Further, I asked them to develop a “turn number” metric so I could track the chain of queries asked in a related group of queries, or a “turn”.
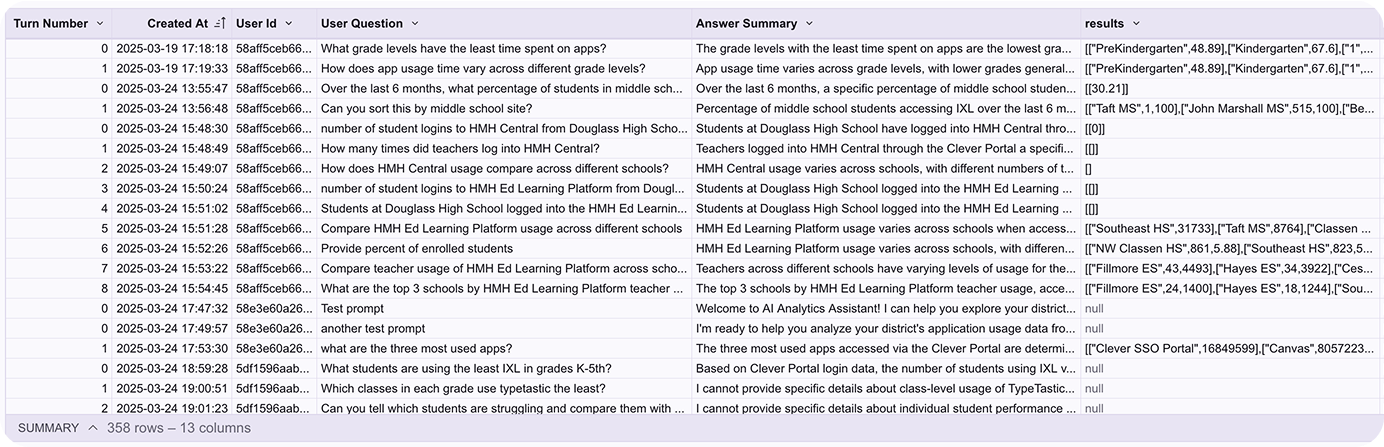
I analyzed participants’ queries, and the sequence they were submitted, using a table I built with my engineering team in Sigma.
Analyzing admin query and AI response logs
SYNTHESIS
I developed a quality rating criteria with my engineering manager and product manager. As a first pass at synthesis, the whole engineering team used these ratings daily to evaluate AI responses as they came in.
As a second pass at synthesis, I organized all of the query and response logs into turns to see how well admins were able to get to their eventual answer.
As a third pass at synthesis, I organized all of the queries into categories to understand what types of queries admins submitted most.

I collaborated with my engineering manager and product manager to set the criteria of response quality.
The entire engineering team went through AI Analytics responses daily to evaluate their quality following our criteria.

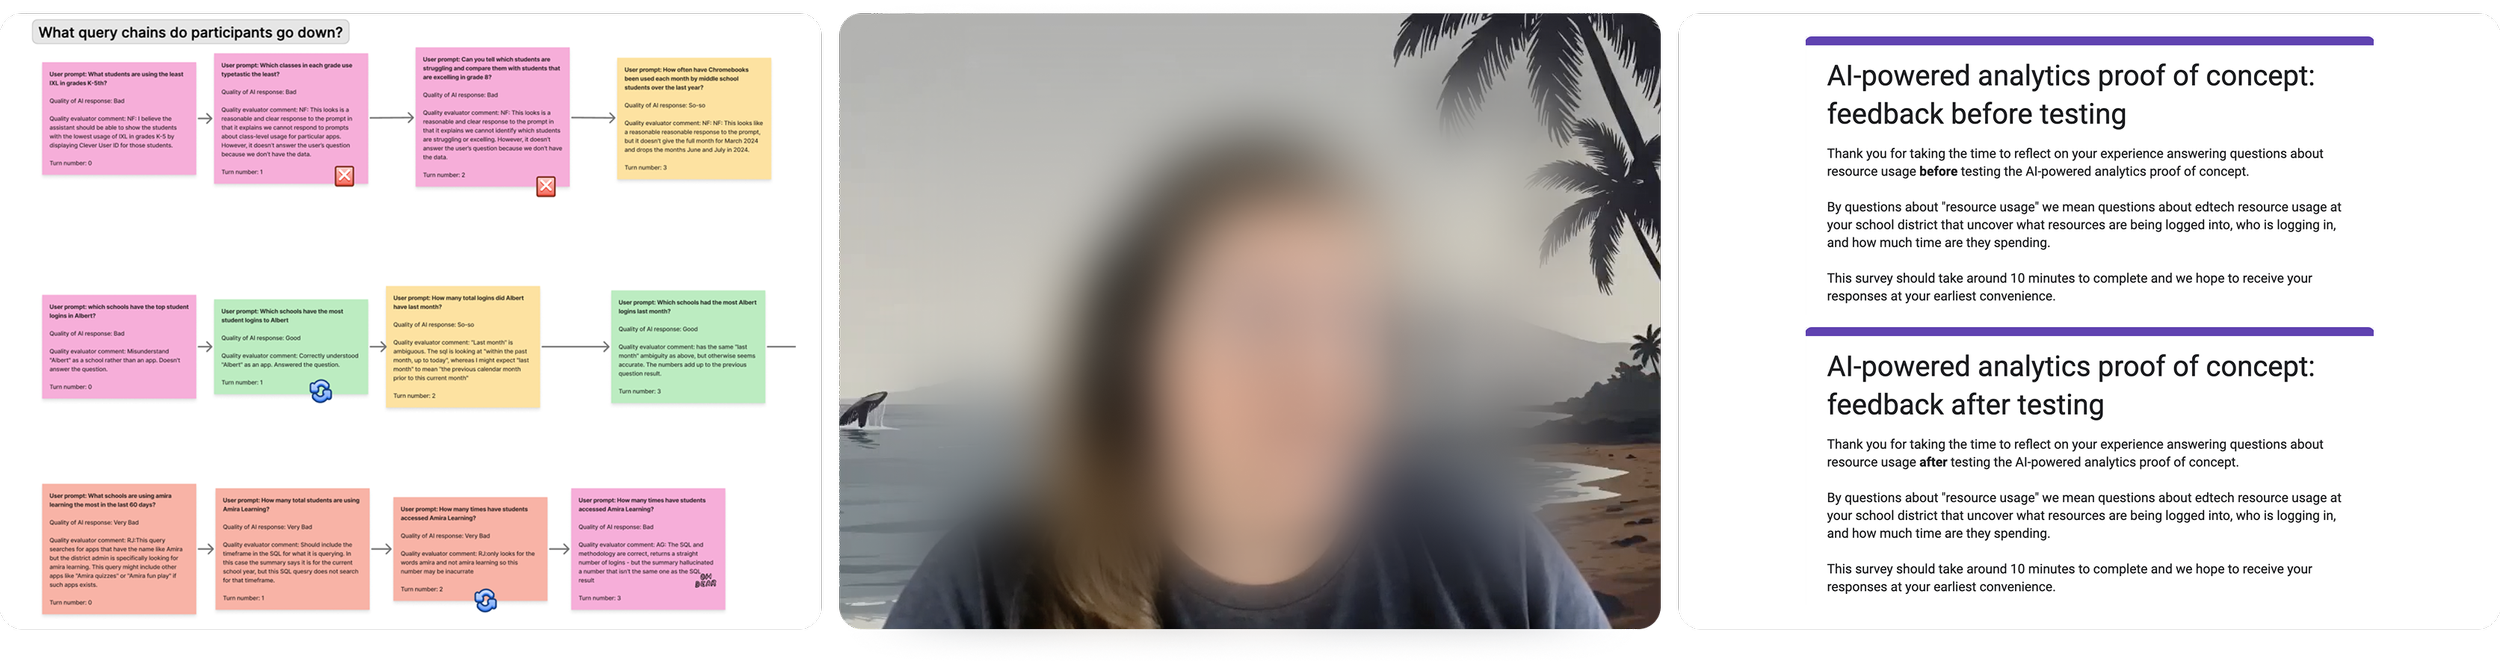
I color-coded stickies to track how well AI Analytics responded to admins’ queries for each chain of related queries.
I organized queries by category to see what types of queries admins submitted most.
The vast majority of questions were in 4 main categories: Compare app usage by school and grade level (39%), Student and teacher usage for a specific app (22%), Least and most used apps (16%), Increase or decrease of app usage (10%).
District admins ask questions in 4 main categories
QUERY CHAIN ANALYSIS INSIGHT
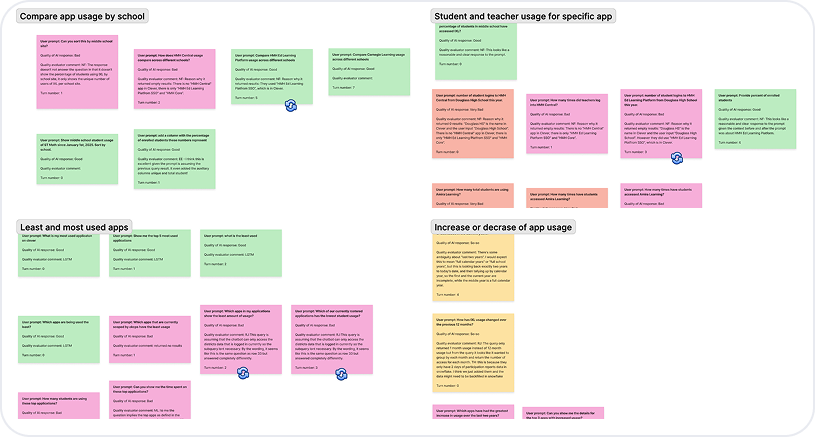
Although there was a long tail of questions related to other topics, the vast majority of questions admins asked were in 4 categories.
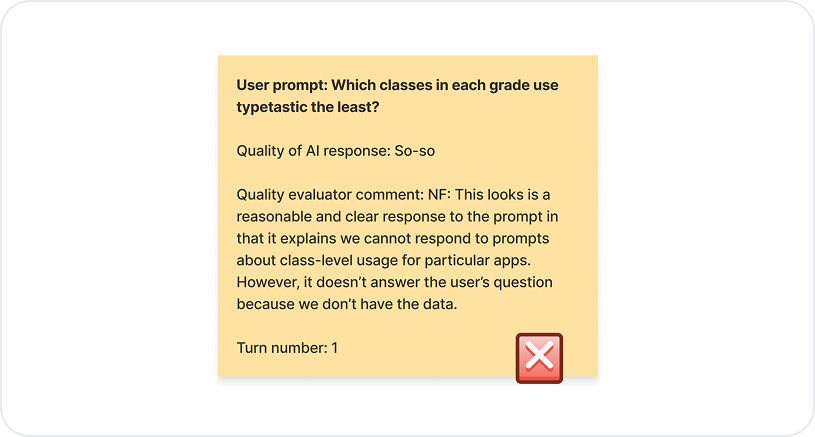
District admins received good responses less than half the time
QUERY CHAIN ANALYSIS INSIGHT
We evaluated the AI’s responses to admins' queries on a scale of good, so-so, bad, and very bad.
Although AI Analytics has more good responses than any other category, its performance was inconsistent, which led to a high number of so-so and bad responses.
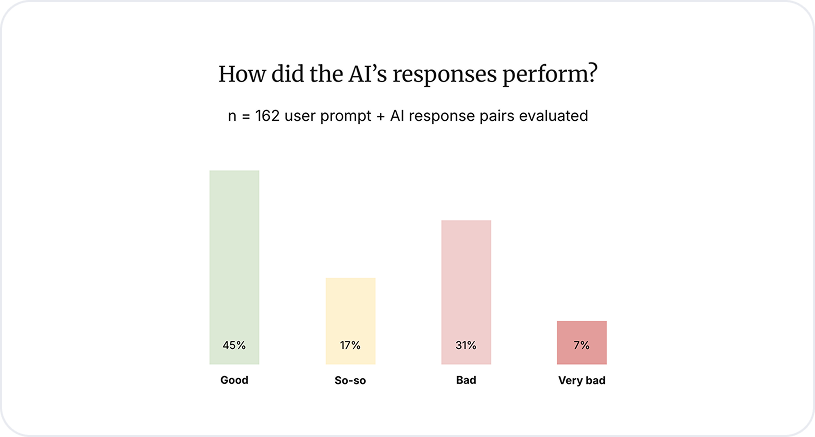
The quality of AI Analytics’ responses was inconsistent, which led to admins receiving “good” responses to their queries less than half the time.
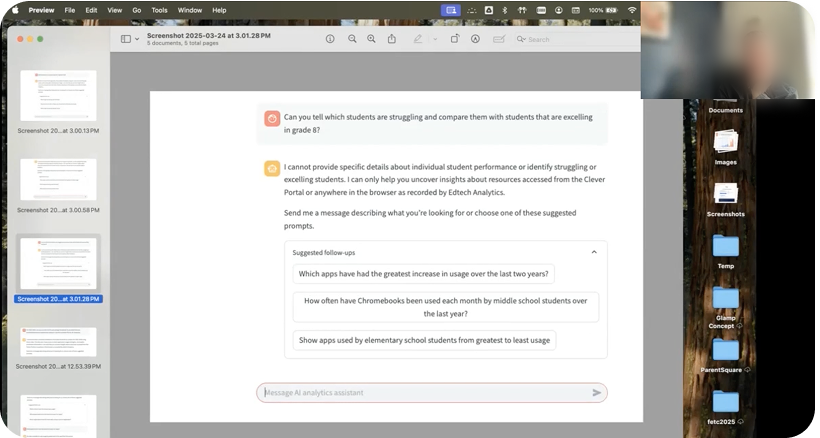
District admins were not able to get answers at the level of granularity they wanted
QUERY CHAIN ANALYSIS INSIGHT
The chain of queries submitted in turn sequences revealed a failure of our system to drill down to the level of granularity admins wanted.
Admins did not receive good responses to queries that sought to drill down to a level of granularity beyond grade level or school, such as specific classes at a school.
Listening to district admins’ experience with AI
1:1 interviews
METHODOLOGY
I chose to conduct 1:1 interviews to hear directly from admins how well AI Analytics was meeting their needs and understand why they were asking the questions we identified in query chain analysis.
I scheduled interviews with participants halfway through the testing period.
Prior to interviews I asked admins to record the questions they asked and the results they got from AI analytics by taking screenshots. During interviews we reviewed these screenshots and talked through them.
A participant sharing their screen during our interview to discuss screenshots they had taken while testing AI Analytics.
Debriefs after calls and affinity mapping
SYNTHESIS
For each interview, I asked one engineer on the team to be a note taker.
As our first pass at synthesis for interviews, I debriefed with the note taker to capture our key takeaways.
As a second pass at synthesis for interviews, I reviewed with my product manager the key takeaways from the interview debriefs and we affinity mapped them into key themes.
After each call I debriefed with the engineer who took notes and wrote down what stood out to us.
With my product manager, I affinity mapped the key takeaways from interview debriefs into key themes.
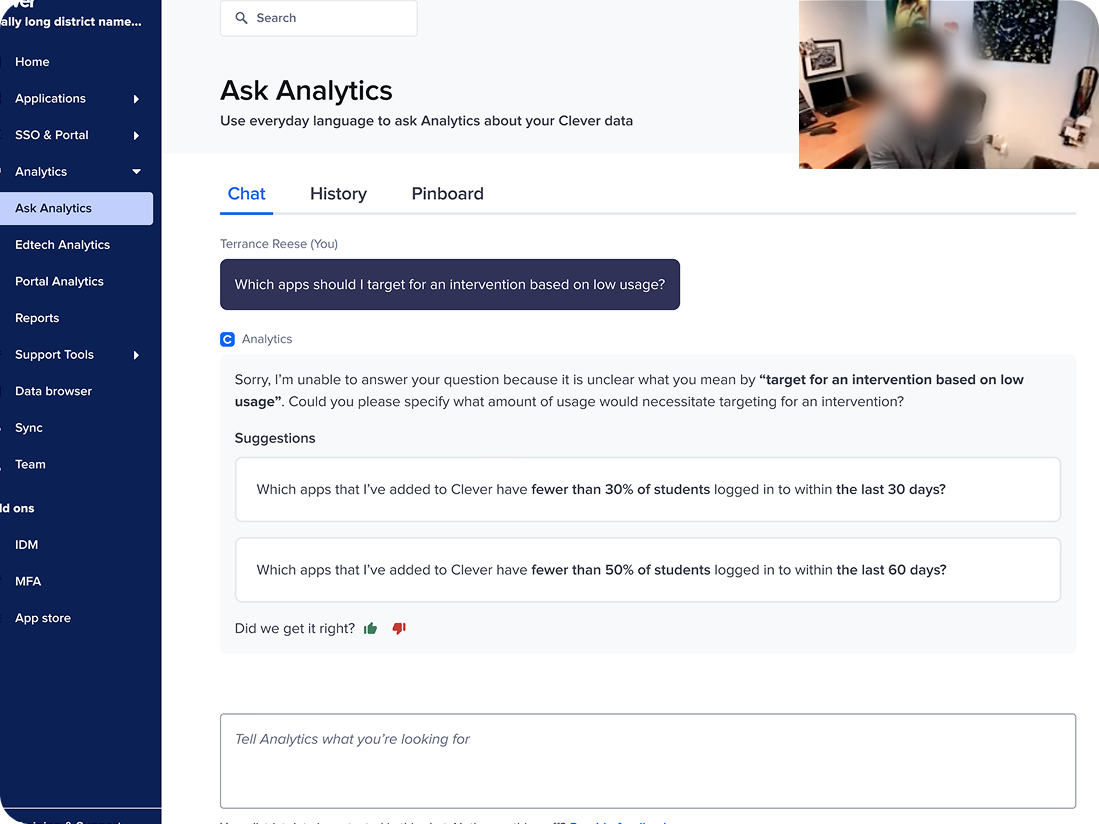
District admins see potential in AI Analytics, but feel it’s not there yet
INTERVIEW INSIGHT
While admins were able to answer some of their questions, the inconsistency in the quality of responses they received made them feel like they weren’t yet ready to trust AI Analytics.
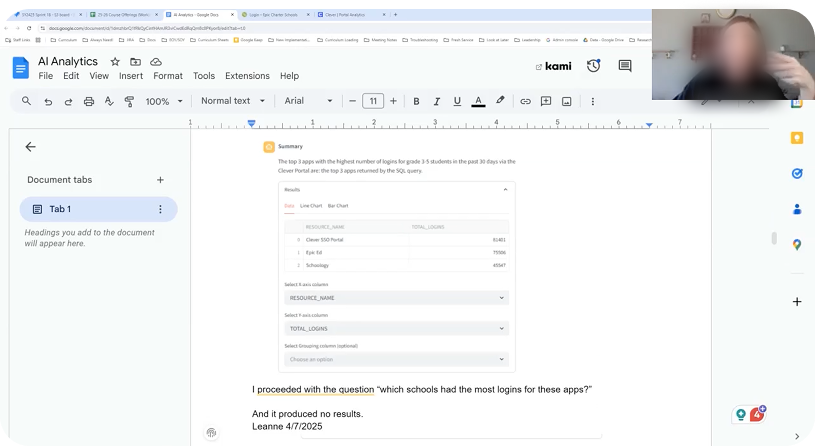
An admin describes how they were not able to get a response from AI Analytics when they asked a follow-up question.
“Based on the things I’ve tried, we’re halfway to meeting our needs. I hope it continues to improve.”
District admins see value for themselves and those who ask them questions
INTERVIEW INSIGHT
Admins consistently expressed that AI Analytics had the potential to be valuable for school level users, which would help reduce the amount of questions they would have to answer as admins.
“I see the value – time savings, empower tech coaches and school leaders to answer their own questions.”
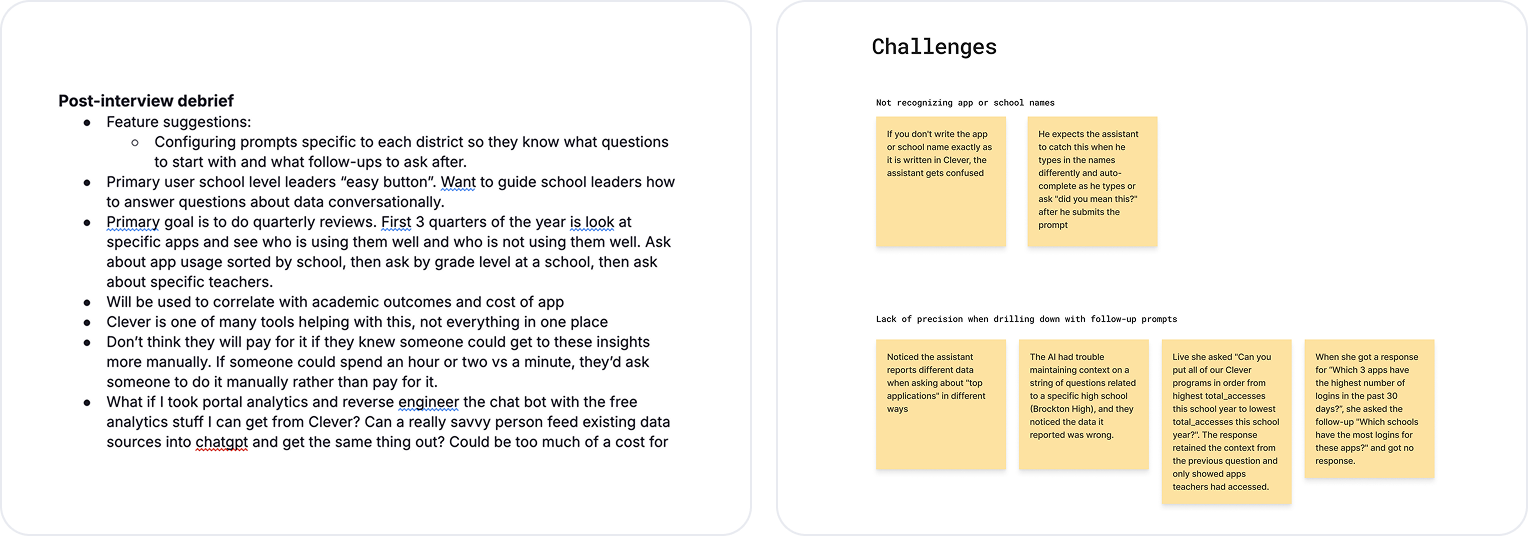
District admins are not confident their district would purchase AI Analytics
INTERVIEW INSIGHT
Although admins would appreciate having an AI Analytics assistant to reduce their workload, they were not confident their district would pay for it.
“An easy button for school-level leaders is a nice to have -- if the district can have someone get these insights more manually for free (from the admin) they would do that instead.”
Comparing district admins’ expectations and actual experience with AI
Pre and post surveys
METHODOLOGY
I chose to send pre and post surveys to compare what admins were expecting to be able to achieve with AI analytics before testing and compare that with their actual experience after testing.
Comparing pre and post surveys
SYNTHESIS
After collecting the pre and post survey responses, I organized them into key themes.
I then compared responses to questions from the pre survey to responses that related to questions from the post survey.
I compared responses to questions from the pre survey to responses that related to questions from the post survey.
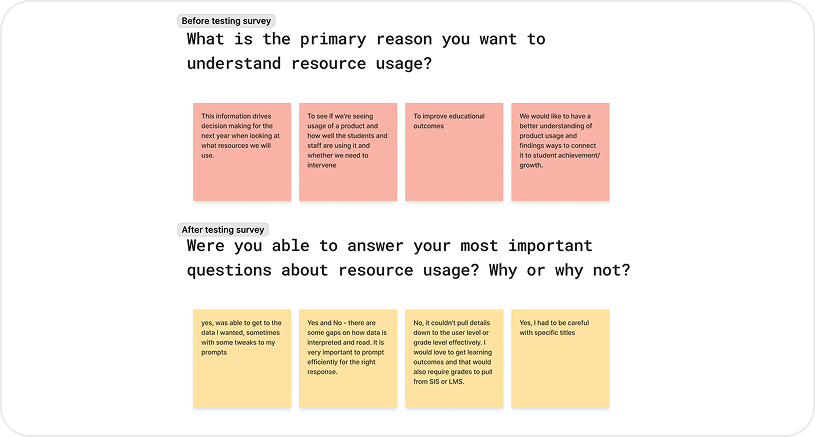
Prior to testing, admins wanted more granular detail in analytics data. After testing they reported not getting answers at the level of detail they wanted.
SURVEY INSIGHT
Before testing
“Today we’re not getting enough detailed analytics on product usage by students and teachers.”
“It couldn't pull details down to the user level or grade level effectively.”
After testing
Prior to testing, admins were excited to ask questions about analytics using regular language. After testing they reported having to repeatedly tweak prompts to get good answers.
SURVEY INSIGHT
Before testing
“I want to be able to easily ask questions to see usage for an app, identify the bright and low spots to see who needs support, and make a nice graphic quickly.”
After testing
“There are some gaps on how data is interpreted and read. It is very important to prompt efficiently for the right response.”
Impact
Met business objective by presenting the testing results to the executive team and identifying that AI Analytics is not yet meeting customer needs
IMPACT
Business objective: Get signal on whether AI analytics has product market fit after we test a proof of concept with bullseye customer districts.
I distilled my key insights from query chain analysis, interviews, and pre/post surveys with the executive team.
This presentation primarily focused on how AI Analytics was not yet meeting customer needs and what resources the team believed it needed to get there.

Our testing results revealed AI Analytics was not yet meeting customer needs. To use the product with regularity, customers needed to trust that they would consistently get accurate answers to their questions.
I identified gaps in our teams’ ability to improve AI Analytics. Making these improvements would require further investment in team skill sets and AI tooling.
Highlighted the main risks testing revealed
IMPACT
When testing the AI analytics proof of concept, the gap in product market fit with bullseye customer districts came in two flavors:
Admins wanted to ask questions about application usage at a level of detail more granular than what our data supported.
Although we could support questions at the grade, school, and user type level (students or teachers), we could not support questions at the class or individual user level. This feedback mirrored requests from our existing services-based, paid analytics product offering and revealed the need for a fundamental reimagining of the data supporting all of our analytics products.
Admins could not completely trust the results of the AI Analytics Assistant due to a lack of consistency in responses.
Although the assistant could provide useful and accurate responses some of the time, our nascent understanding of tuning AI models impacted the consistency of its performance. This feedback revealed the need for our team to develop a more robust evaluation framework to iterate on improvements to the AI assistant’s performance and share that framework with other teams that planned to experiment with AI product development.
Guided a pivot to focusing on user-level data, resulting in $92K ARR for an analytics service package
IMPACT
Based on my research findings and recommendations, rather than continue to build and ship an AI Analytics Assistant in 2025, the executive team requested our team shift focus to restructuring our analytics databases to include user and class level data to support all of our analytics products.
By restructuring our analytics databases to include user and class level data, we enhanced our analytics service package that preexisted the AI Analytics Assistant, resulting in $92K ARR for 2025.
IMPACT
Reflections
Develop an automated evaluation process earlier to avoid lots of manual effort
I had a great team of engineers who helped me evaluate query and response pairs daily as they came in. However, this process was time-consuming and very manual, which led to fatigue on the team. If I were to do this project again, I would work with engineering to develop an automated evaluation process sooner so they didn’t have to expend as much manual effort.
Create a more formal way for participants to record their thoughts and reflections throughout the testing period
During the testing period, I asked participants to take screenshots and record their thoughts as they completed testing. However, I did not provide them with any templates or materials to do this, which led to a variety of ways of documenting their thoughts – including some forgetting to take screenshots or write anything down at all. If I were to do this project again, I would create formal materials for participants to use throughout the month-long testing period so their output would look more like a documented diary study.